Building the Dashboard of My Dreams
Becoming a DevOps Engineer with the Help of Claude
dashboards and metrics/alerting are usually either expensive or slow to build — the old cheap/good/fast problem. but with Claude, my network-engineer brain got bumped up to data-scientist status, and together we built a metrics/monitoring/dashboard platform on open source. all of it is running on a humble 2cpu virtual machine up in vultr with 65gb of ssd storage.
here's the architecture:
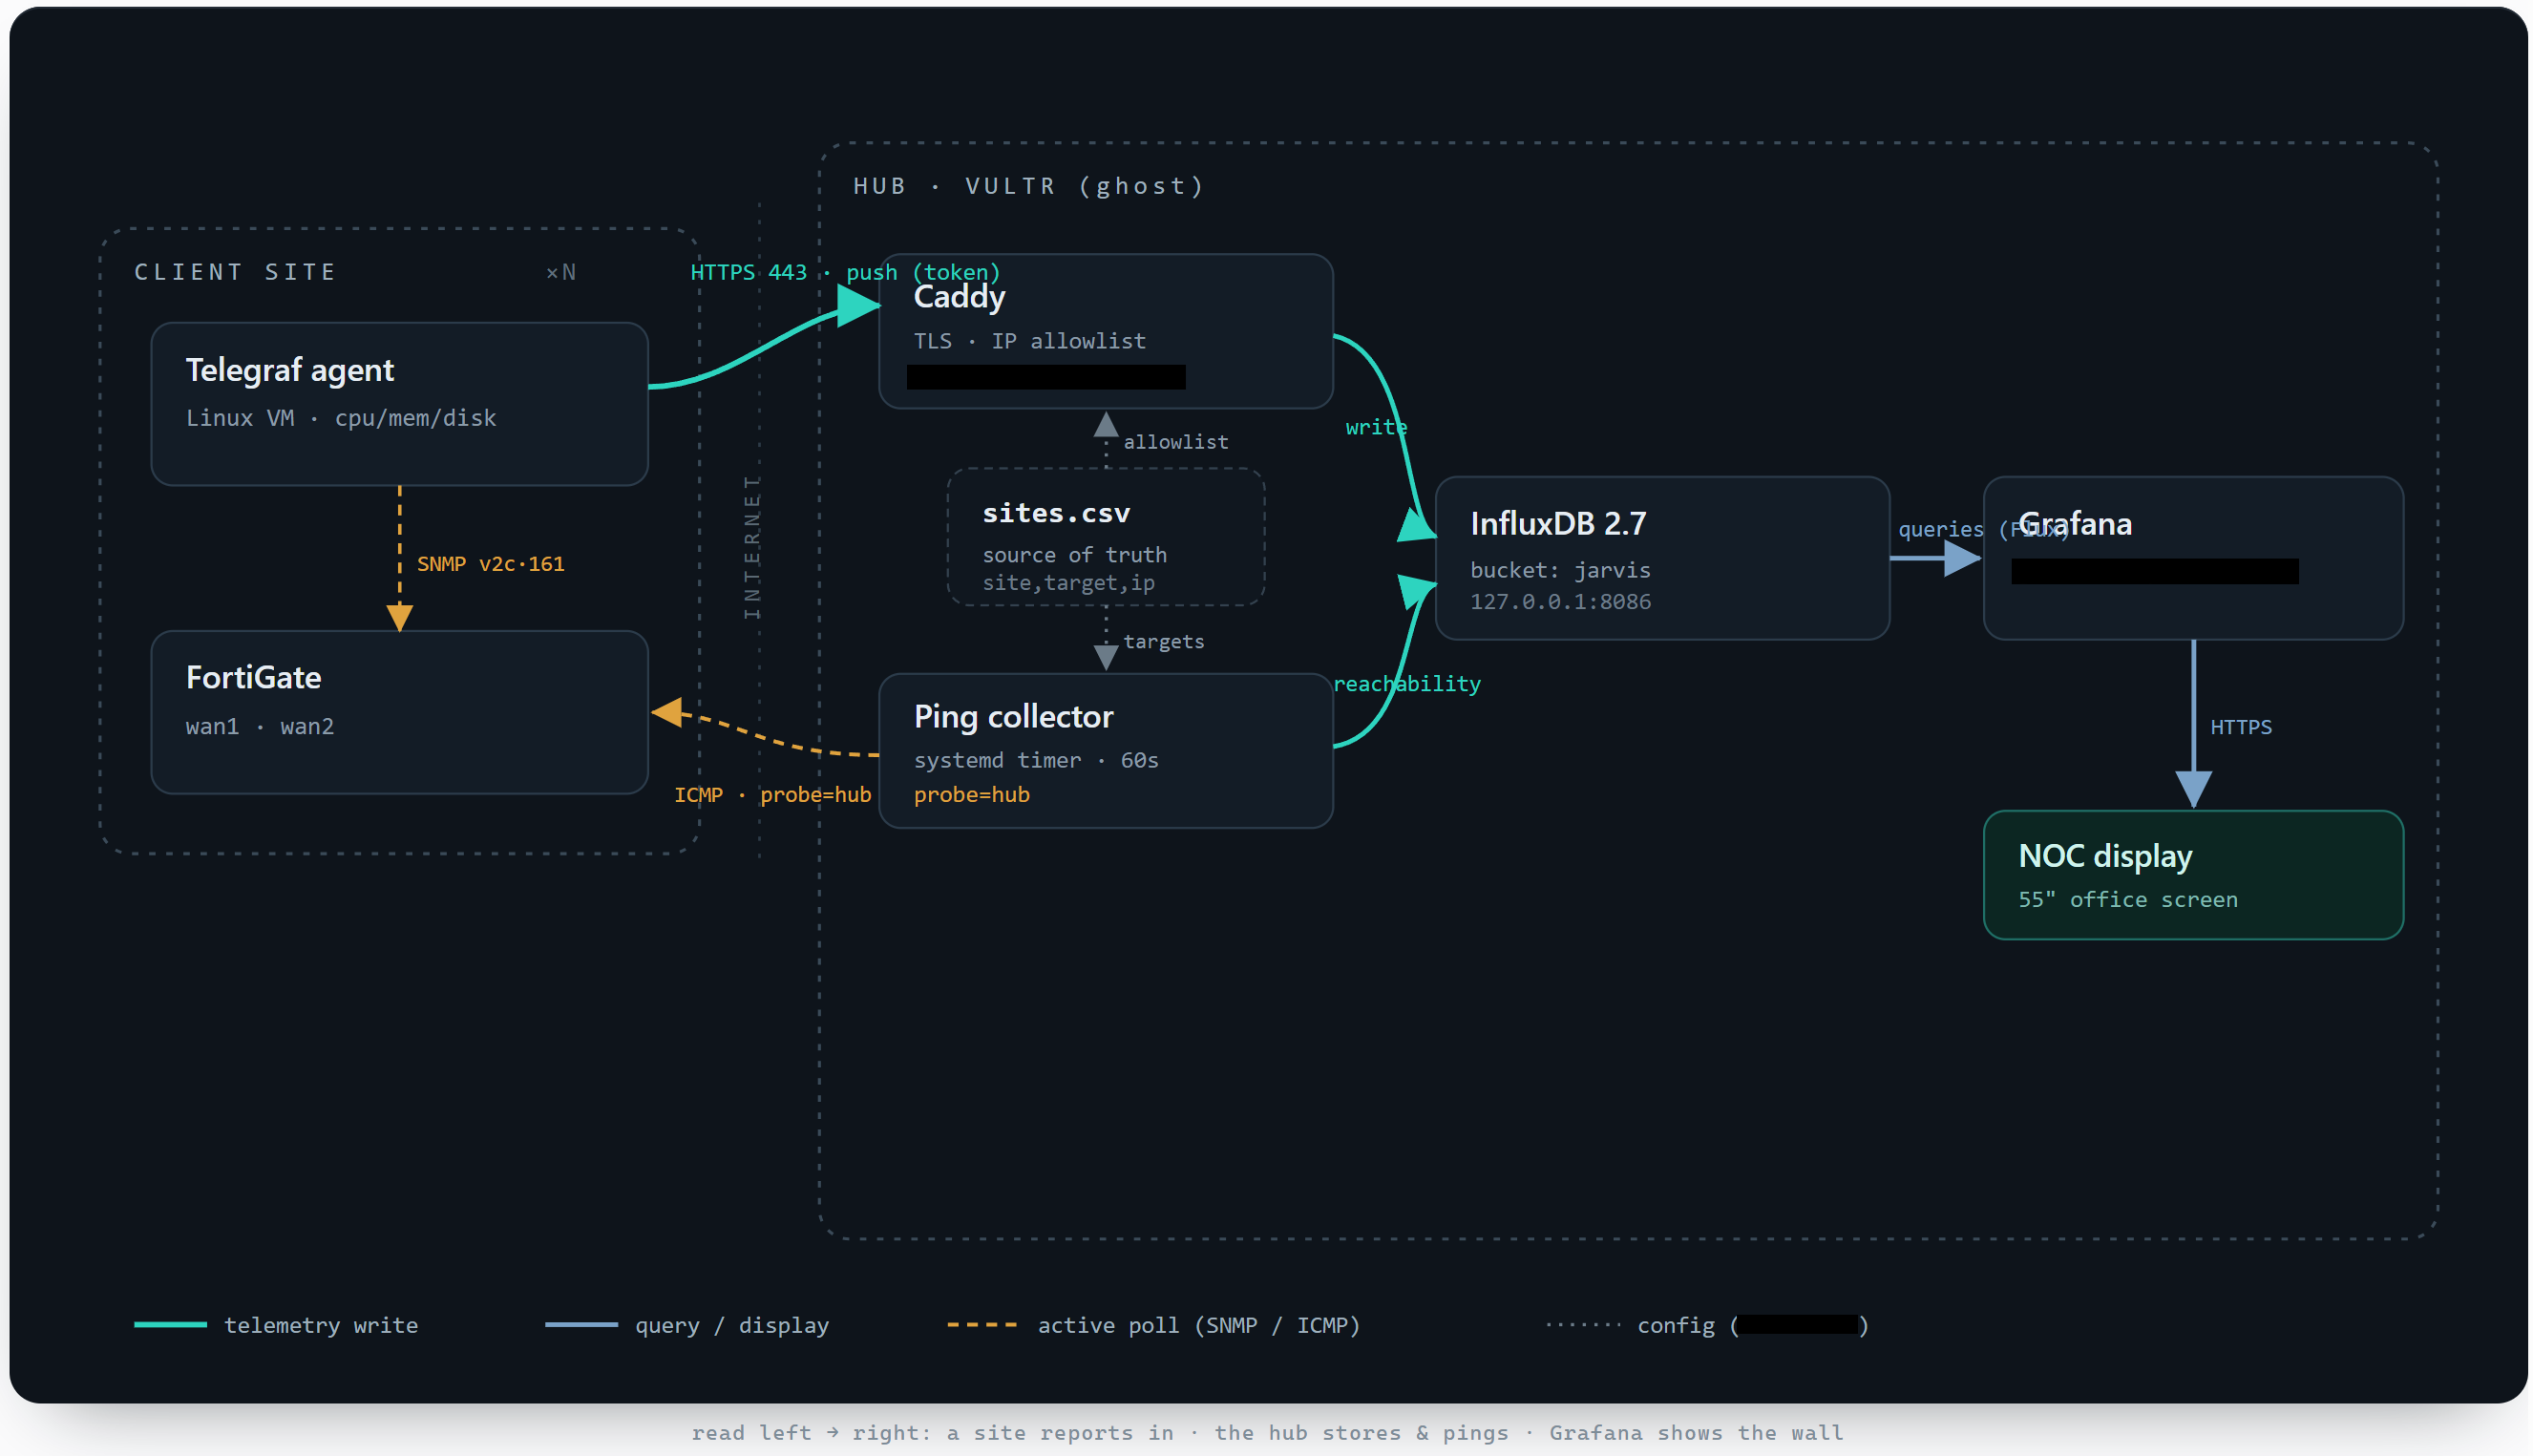
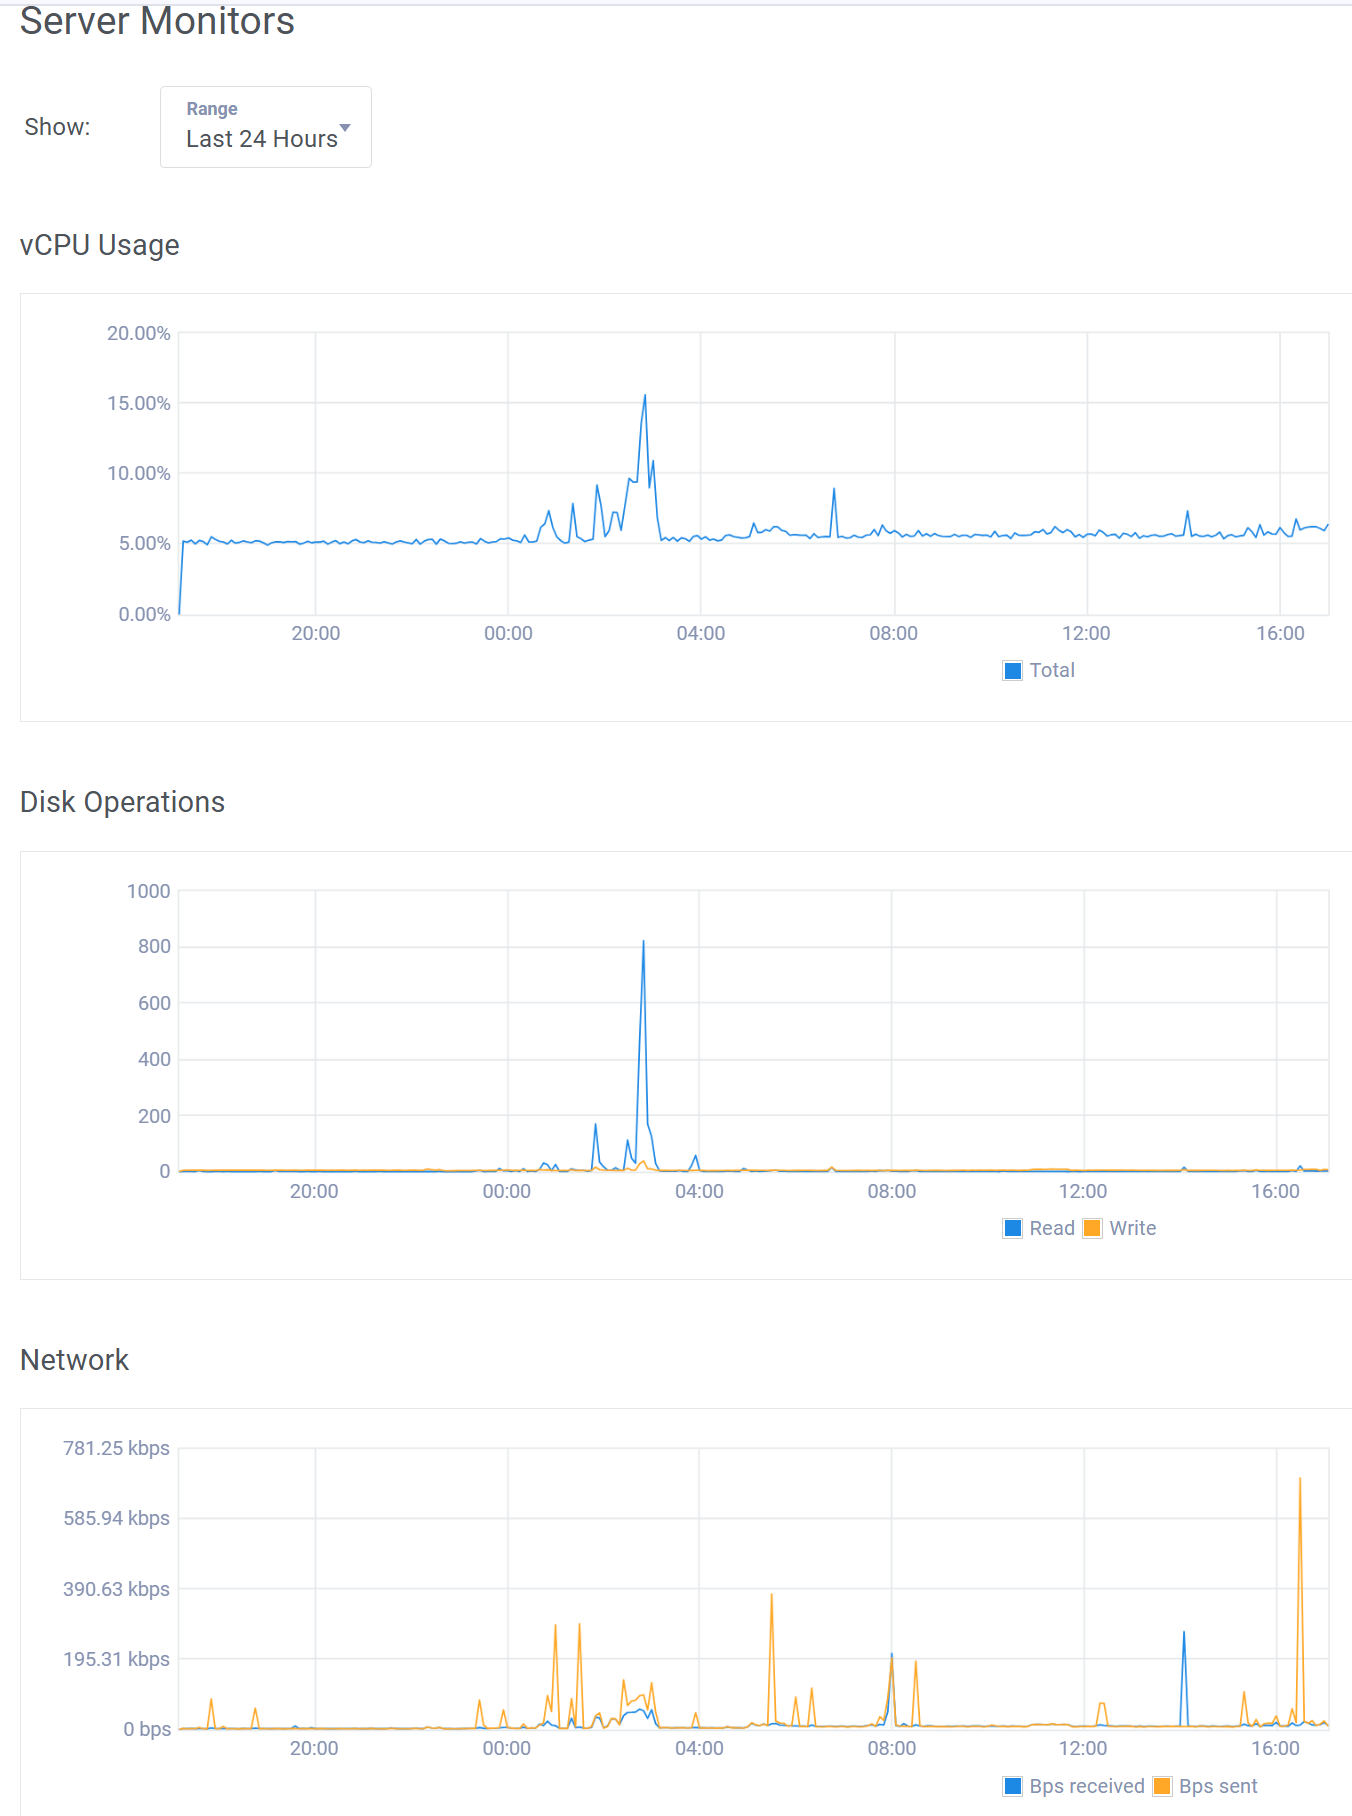
- The agent reports in. Telegraf polls the FortiGate over SNMP and gathers the VM's own host metrics, then pushes everything out over HTTPS from the site's static WAN IP.
- Caddy is the gate. The push lands on our cloud linux vm; Caddy checks the source IP against the allowlist and the write token before proxying to InfluxDB, which never faces the internet directly (loopback only).
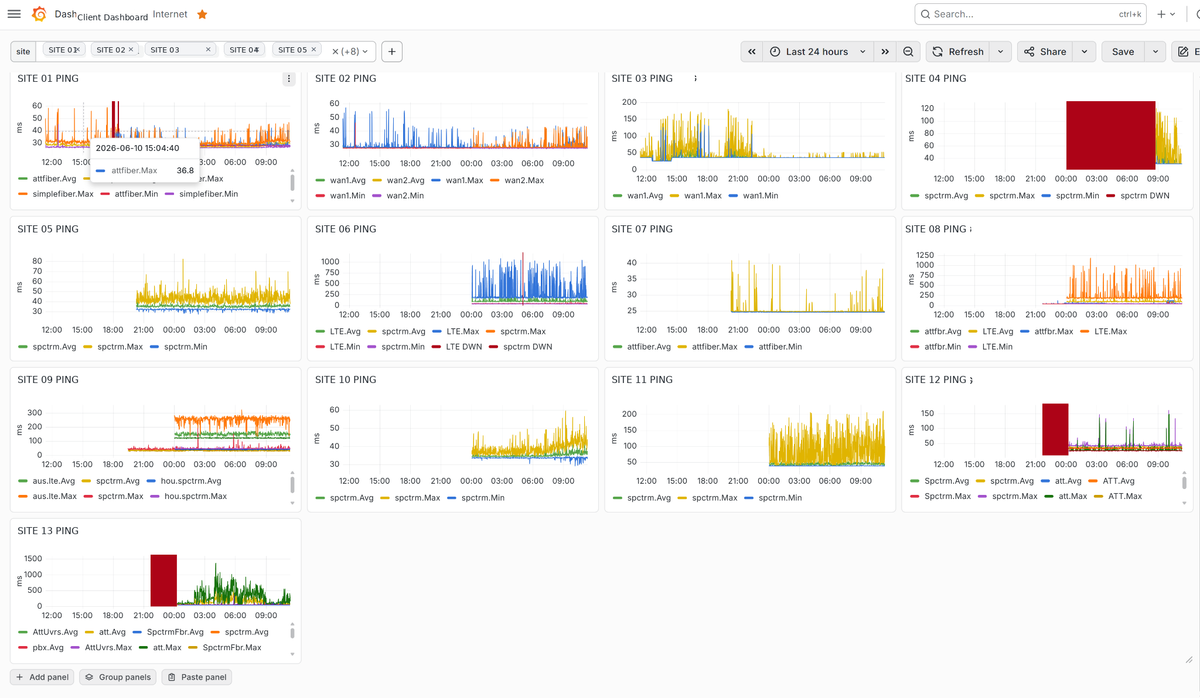
- The hub watches from outside. Independently, the ping collector pings each site's WAN every 60 s and writes reachability tagged
probe=hub— so you still see up/down even if the agent is down. - One source of truth.
sites.csvdrives both the ping targets and (via the sync script) the Caddy allowlist. Edit it in one place; both follow. - Grafana shows the wall. Grafana queries InfluxDB and renders the dashboard on the office display.
since this is only metrics, IP access lists are enough to gate writes to the database--no heavier auth needed.
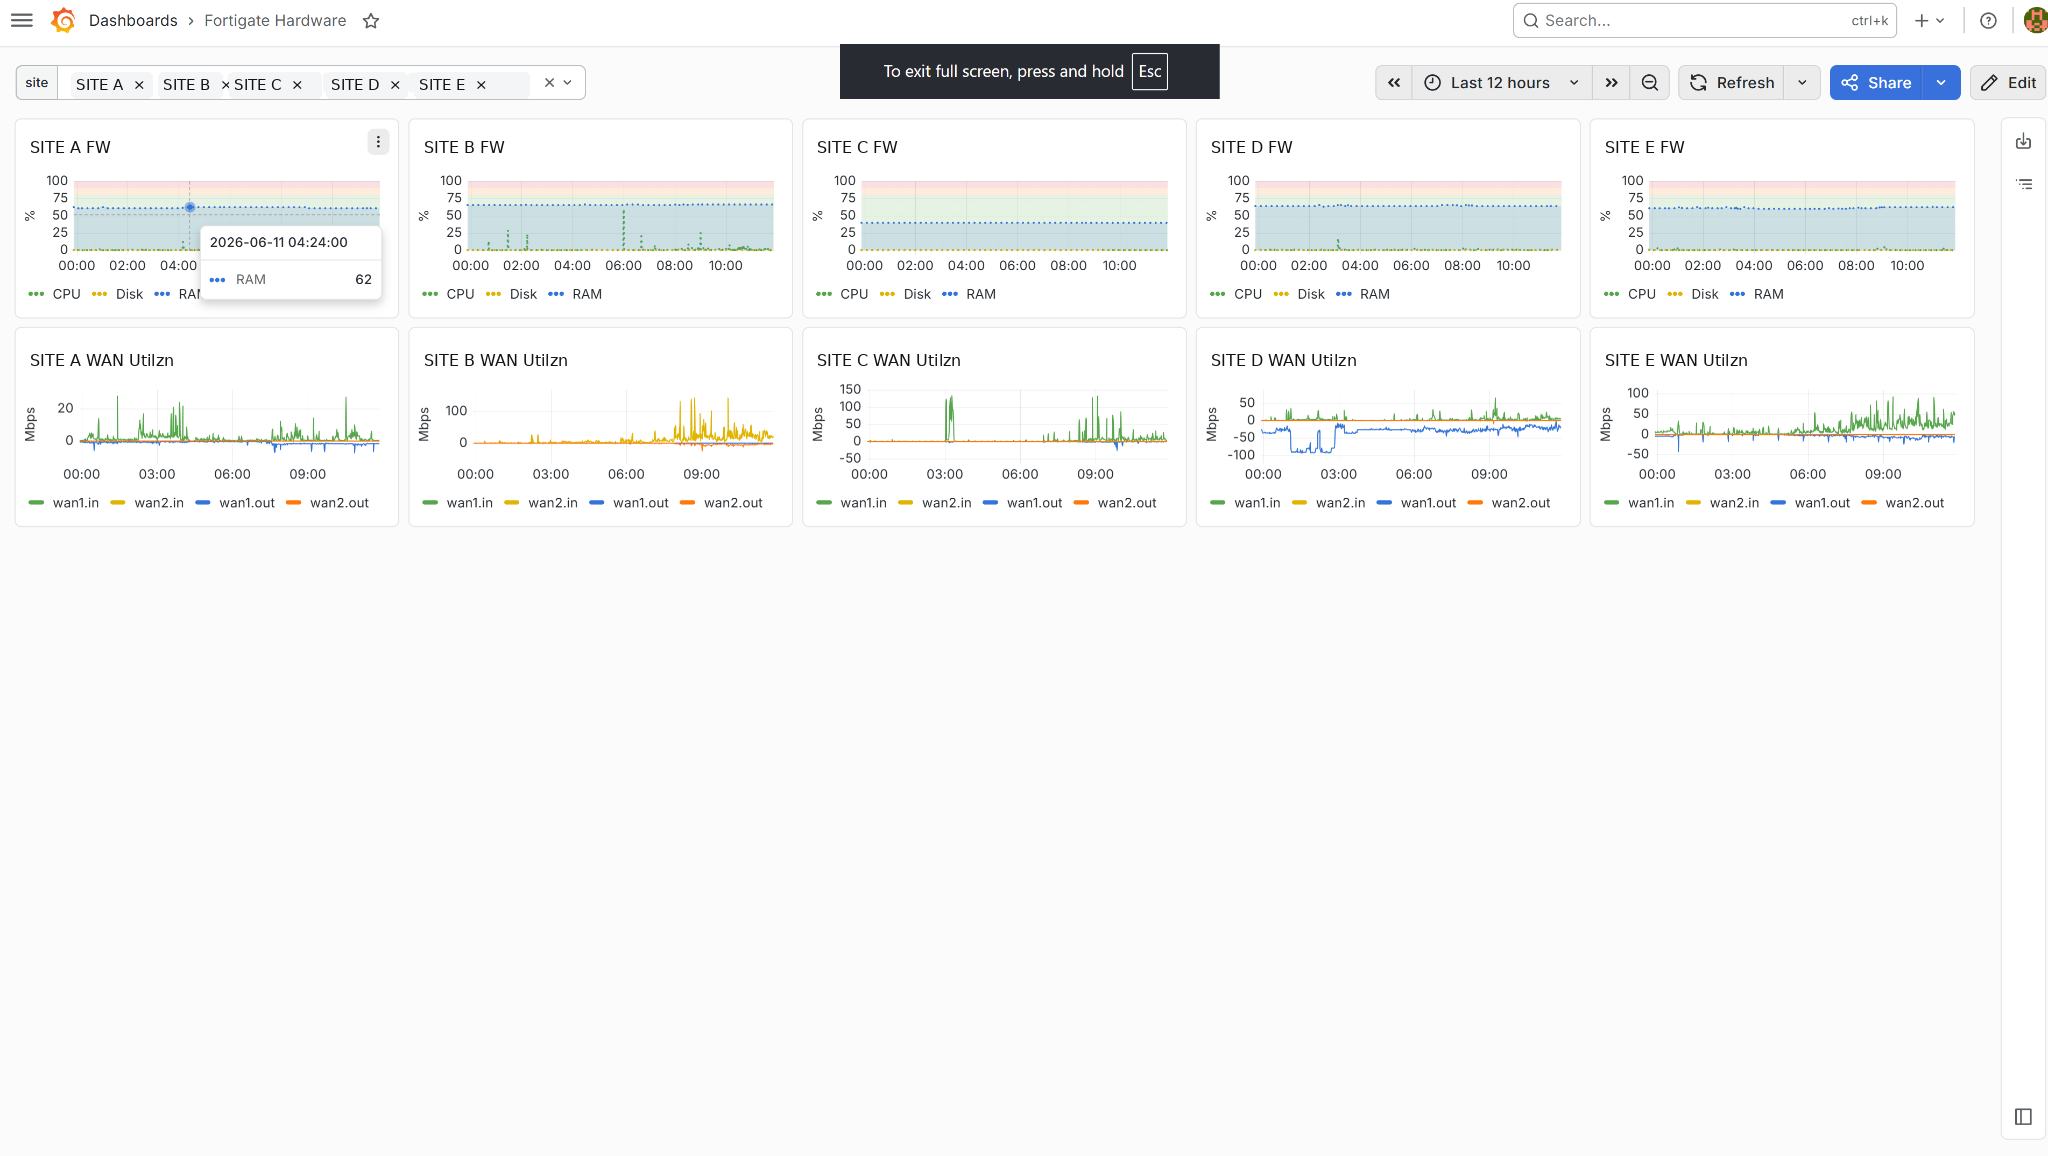
every chart is driven by a database query, and i'm no SQL DBA. Claude wrote all of it; i just said what i wanted to see. the goal was PRTG-like charting, and i think we're there. i'm especially proud of the red bars that appear when something's down. alerting runs through Teams webhooks.
i've already got the firewall hardware and WAN throughput monitoring working — now it's just a matter of rolling it out to the rest of the clients.
next is pointing Telegraf at Veeam over its REST API so we can retire our email-parser backup monitoring (CheckCentral). after that, polling the servers for hardware faults — failed disks, temperature, power-supply failures.
this has been a blast. it's not every day you get to live out your dashboard dreams ❤️